Double Duty for RNA: Part 2

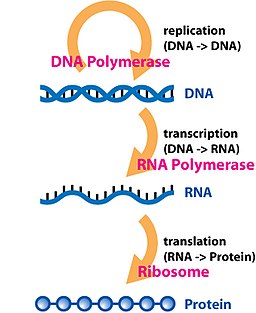
We covered a study on RNA and population genetics previously, but left with a question. What if RNA sequencing was used to study both genetics and molecular physiology? As an intermediate between DNA and proteins, it carries genetic variation in the DNA that codes for genes, while the abundance of the different messenger RNA transcripts tell us what genes might be important for a physiological response under some condition. RNA sequencing as a technology is up to the task, as well, while there are numerous bioinformatic tools available. Since biology and technology aren’t limits, why not investigate genetics and physiology in tandem with RNA sequencing?

Our study

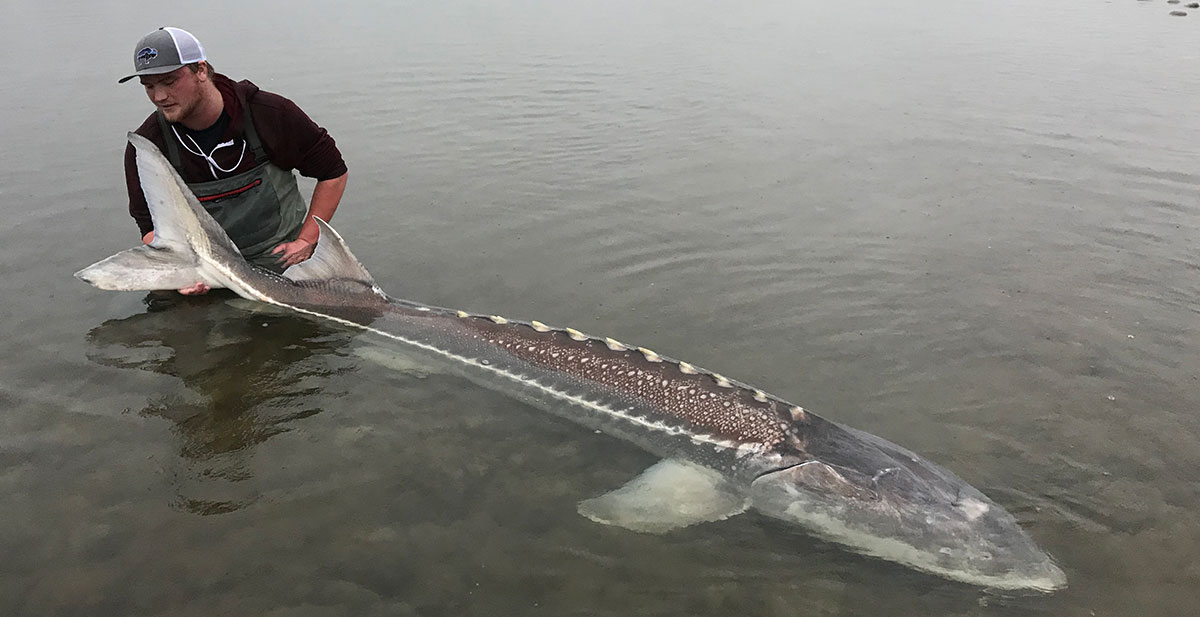
That was our study. We based it on a couple other datasets to validate our findings. The primary one was previously run by by supervisor at the time, Ken Jeffries, who had done RNA sequencing work on the Sacramento splittail. They are under decline but not listed as endangered. Water issues in their native range in California’s San Francisco Bay are incredibly contentious, though, and climate change means that those issues won’t be getting easier to manage. One way that water affects the splittail’s population is through how salty it is- less water being released into the Bay means that their environment is getting saltier. So as part of his work, Ken led an experiment with wild individuals from two populations of Sacramento splittail exposed to elevated salinity: one less tolerant of salinity (a Central Valley population), and one more tolerant of it (a San Pablo Estuary population). He did RNA sequencing on samples from control, 3-day salinity exposure, and 7-day salinity exposure groups, and wrote a nice paper on the results.

We knew that the two populations of splittail were different because of prior genetic work with microsatellites. So any genetic findings we made would need to be consistent with those other results before we believed them. The cool thing about RNA sequencing, though, is that it gives us specific nucleotide differences within genes- something microsatellites can’t really do. Given how different the two populations were at tolerating salinity, we thought that we could identify the genetic variation in genes that drove differences in their salinity responses. In addition, Melinda Baerwald, one of the authors on the original microsatellite study, offered to share the microsatellite data they used. So not only could we look at genetic variation that might be important for these fish, but we could directly compare genetic microsatellite and RNA results to see how well (or not) RNA sequencing gives estimates of genetic variation and differentiation. Establishing whether the RNA sequencing gives us similar results as the well-validated DNA-based method would also lend some credibility toward novel RNA results, as well.

Fig. 1 from our paper, showing that genetic variation from RNA (single nucleotide polymorphisms, or SNPs) reflect population structure similarly to the well-tested microsatellites.

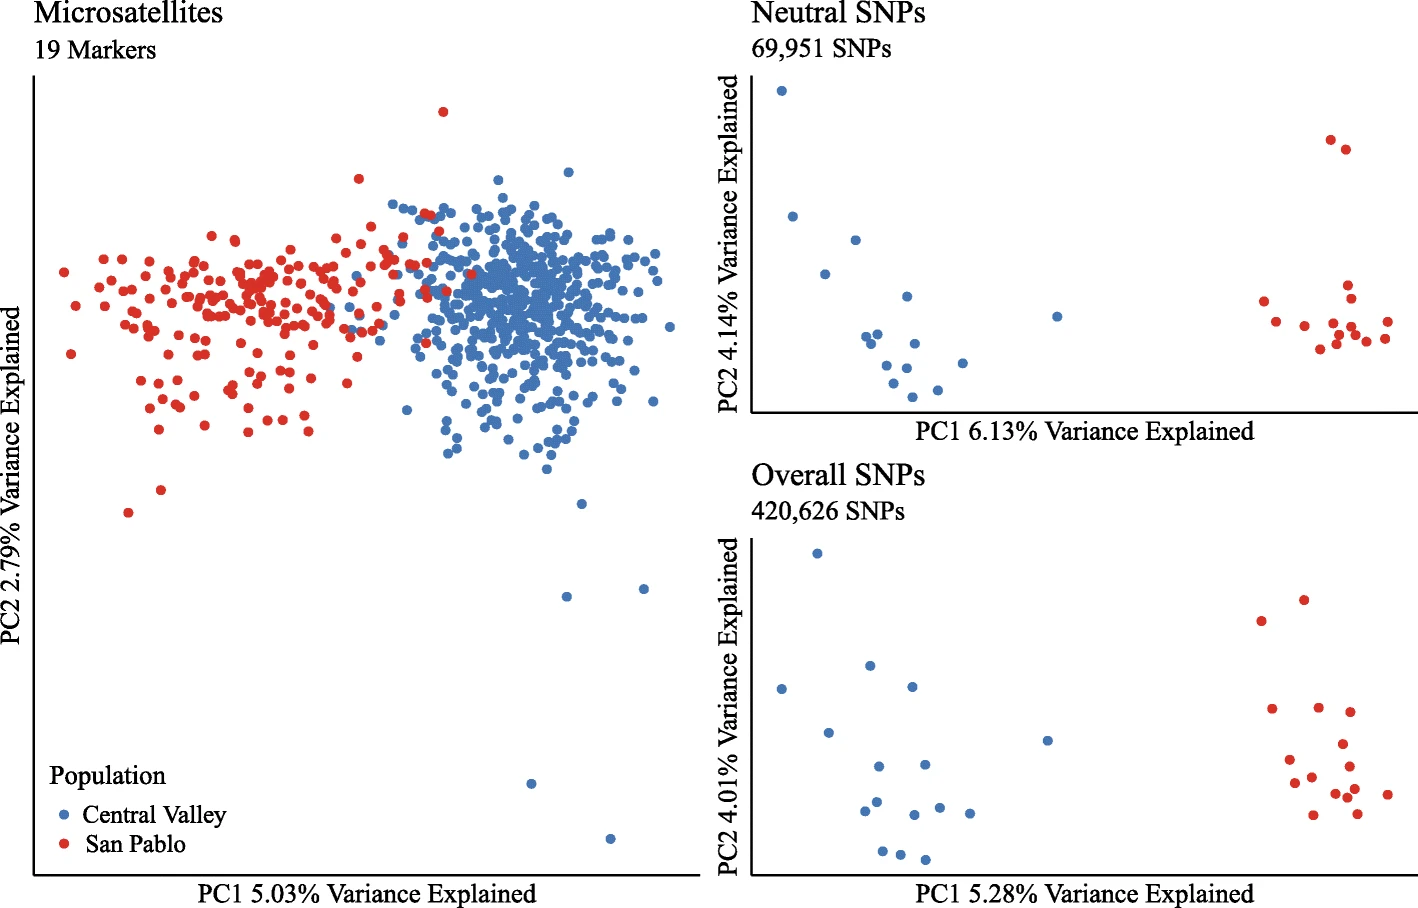
Genetic differentiation as measured with RNA sequencing was consistent with differentiation from DNA here. The flipped X-axes on the PCA are no big deal, it’s the variance explained and discreteness of the different groups that’s important here. While the populations used in the RNA-based PCAs do look more discrete, as in they’re not overlapping with each other, personally I don’t see that as a big deal either since there are so few samples in the SNP data than with microsatellites. If there were more individuals sequenced for RNA, which would cost a lot of money, then the groups might overlap more in the PCA. How about measures of genetic variation?

Table 1 from the paper, show results for genetic variation between RNA-based SNPs and DNA-based microsatellites.

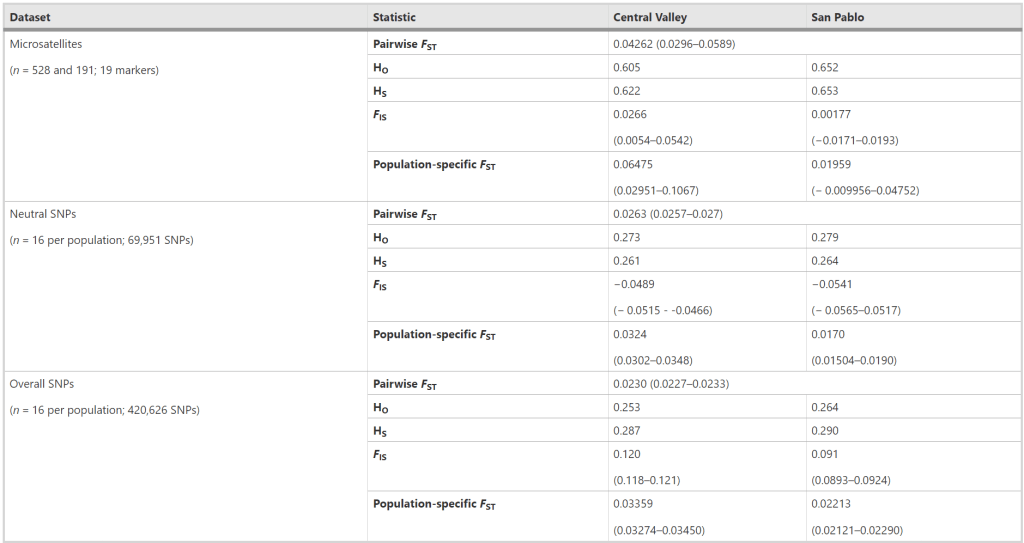
Strictly speaking, this table is pretty awful to look at. I apologize for making it. It’s worth a quick look, though, since the results are so clear. Population differentiation (pairwise FST) identified with microsatellites was actually higher than that identified with the RNA SNPs, which is a little unexpected given how discrete the RNA groups are in the PCA above. But I think it’s a sample size issue, as pairwise FST had more ‘information’ about each population to work on with the microsatellites. Heterozygosity and gene diversity (HO and HS) were a couple times lower for the RNA SNPs and the microsatellites, which is pretty interesting since those are key measures of genetic variation.

What do these results mean? In this system, RNA underestimates genetic variation and differentiation compared to DNA. It’s an intuitive result to me because genes need to do things, whereas DNA in between genes, such as the microsatellites used here, don’t ‘do’ things really. There’s a term for what this in-between DNA is: junk DNA. This stuff is often ‘neutral’ from a genetic standpoint because it’s free to build up mutations, but that’s a superficial explanation and there’s a lot more going on. Genes, meanwhile, are limited in the mutations they can build up because any given mutation is more likely to be harmful than beneficial in a gene, so they have negative selection against mutations building up. Since mutations can’t build up as much in splittail genes here, then the RNAseq results don’t look as different between populations than the microsatellite results. So RNAseq could still be used for surveys of genetic variation in wildlife, but someone looking at the data would need to remember that the values are likely lower for RNA than an equivalent DNA-based dataset.

Isn’t the fact that the genetic variation, the SNPs, that we get from RNAseq representing genetic variation in genes useful, though? In other words, those microsatellites are nice for being well-established markers of genetic variation in DNA, but the SNPs from RNAseq might tell us how different genes are between groups. And those differences in genes might drive phenotypic differences between groups, such as how the San Pablo splittail can tolerate salinity much better than the Central Valley ones. Absolutely, and that was what we did with walleye RNAseq in Lake Winnipeg in the first part of this 2 part series.

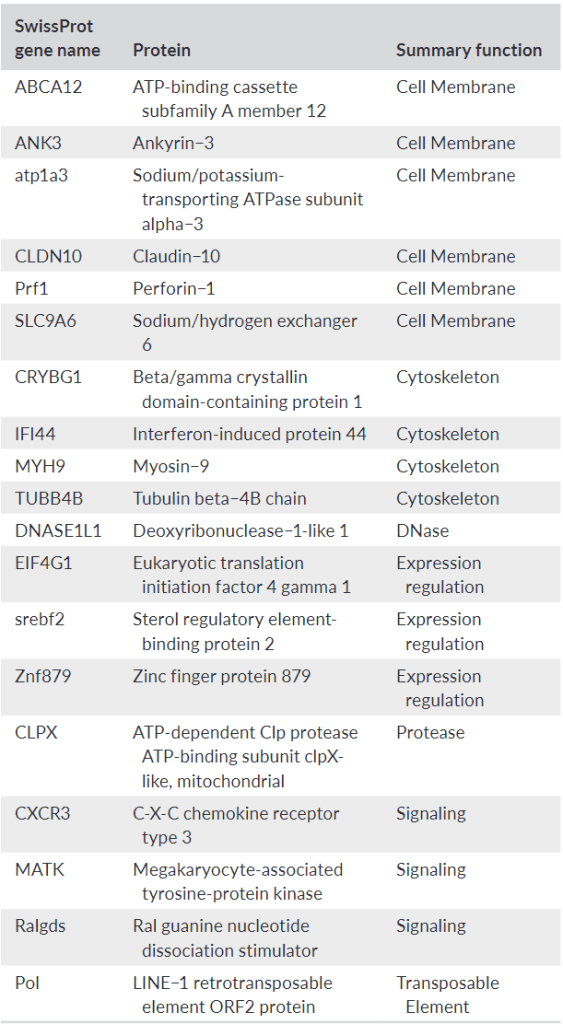
In this splittail paper, however, we took things maybe a step further. We wondered whether the genes that changed in their plasticity were also the ones that were genetically different between populations. Plasticity here refers to physiological ‘flexibility’, as in those genes were able to change how they were expressed somehow in response to salinity in Ken’s initial experiment. We first looked at differential gene expression, or differences in the abundance of the messenger RNA at different groups and timepoints. That was something Ken had analyzed in-depth with his initial paper. However, we also looked at alternative splicing, which I think of as a ‘building block’ approach to assembling a gene by splicing out bits of RNA (introns) and keeping other bits in (exons). By changing which bits are spliced out, the final protein can look different. The least common thing by far that we looked at was gene expression variability, although we found no significant results using that analysis (as cool as it is). Naïvely, I thought that the genes that had some kind of plasticity above would be the ones that were also genetically different between populations. I was incredibly wrong.

Figure 2 from the paper, showing that genes with plasticity (vertical axis) are not the ones with genetic differences between populations (horizontal axis).

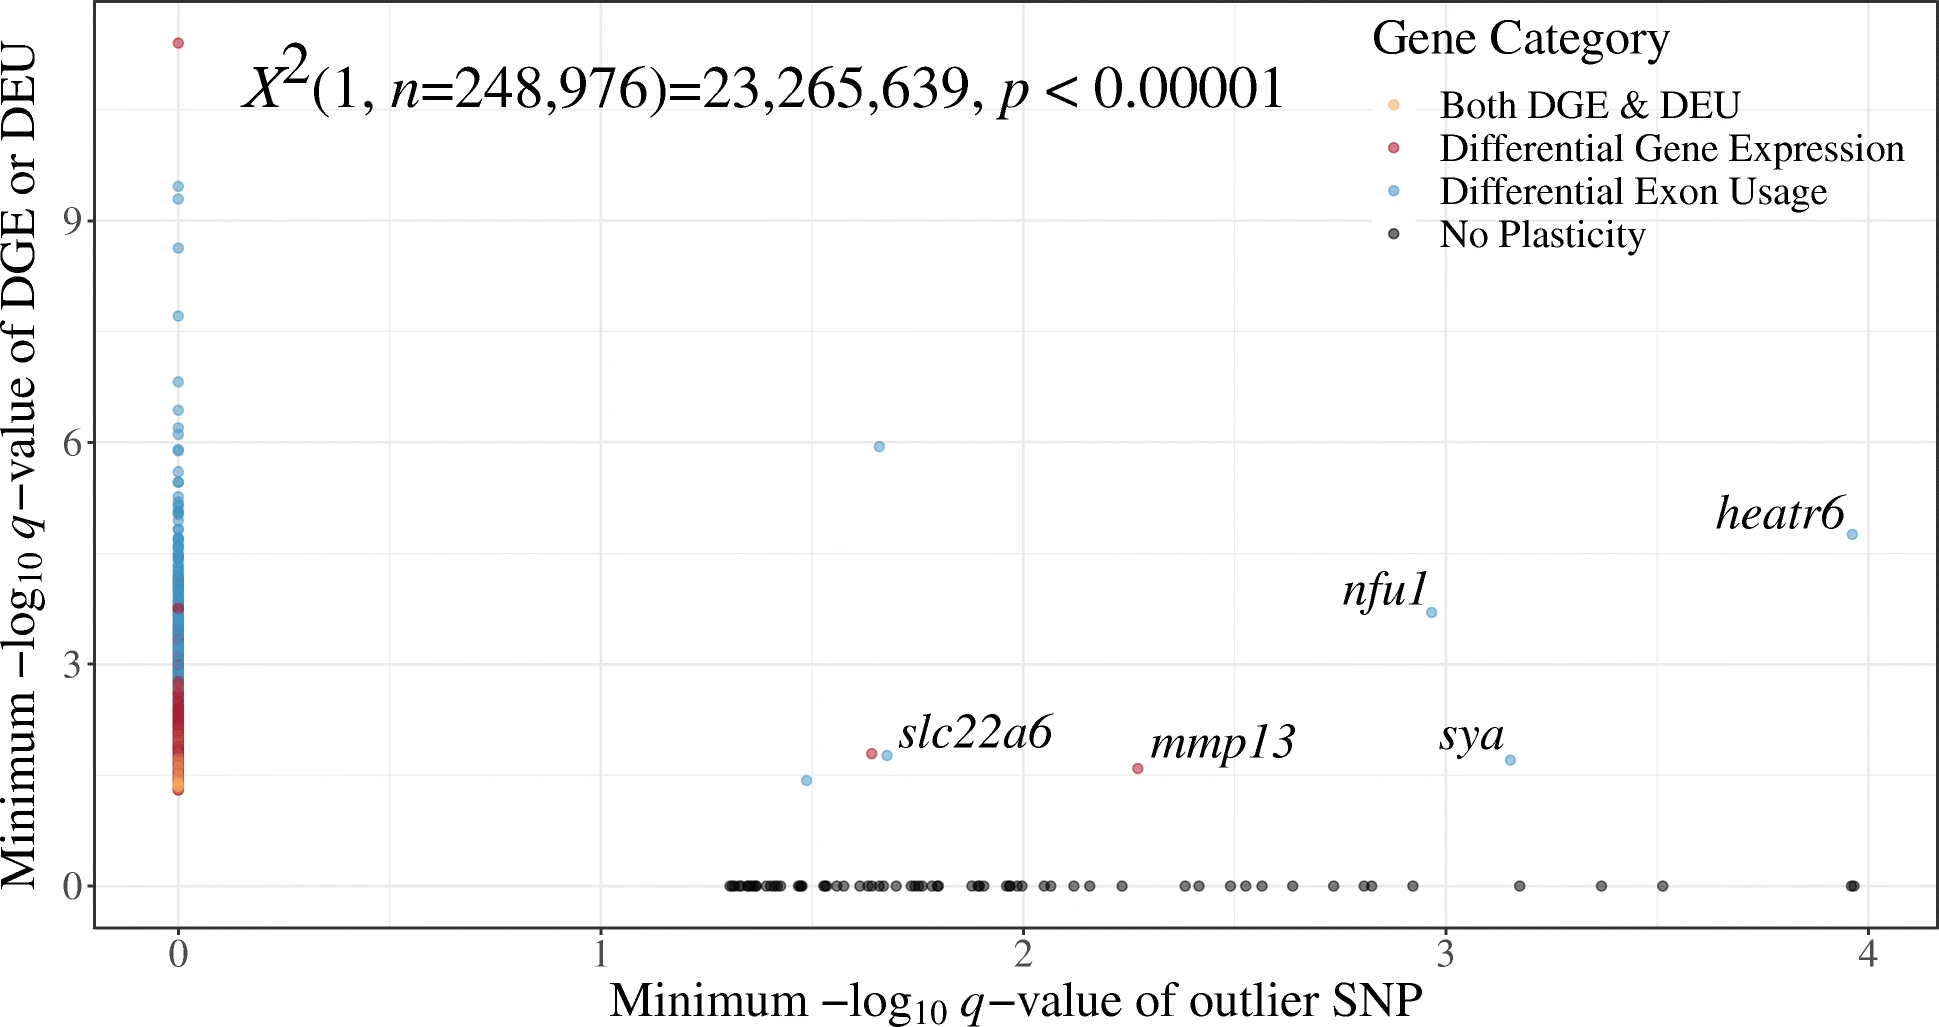
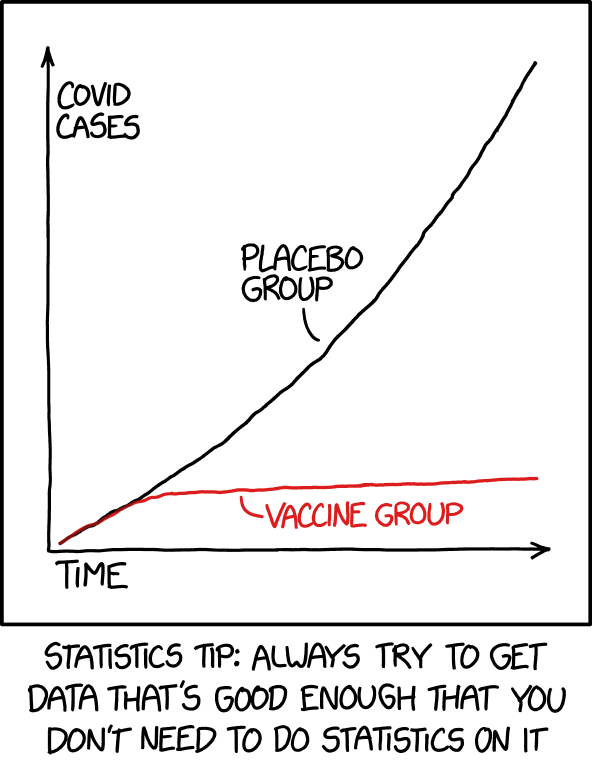
I was so wrong that the XKCD comic to the right seemed appropriate. Nevertheless, I did a chi-squared test of independence (results are in the X thing at the top of the figure) and the results are almost hilariously high. With 1 degree of freedom, a value of 3.841 seems like it would have crossed the threshold into ‘significance’, and the result here is 23.266 million. Biologically, this was pretty cool. It meant that the genes that were involved in a plastic response- changes in expression or splicing here, were not the ones different between splittail populations.

As always, XKCD has a relevant comic.

What’s up with that? Maybe what’s happening is that the genes that could change their plasticity somehow, whether by changing abundance of mRNA or how the proteins may look through splicing, did not need to undergo selective pressures to adapt to salinity differences. Genetic variation built up in those genes, but it might be neutral instead. There are some studies that found similar patterns to us, while others identified the opposite pattern- the genes that seemed to be under selection were also the ones that exhibited plasticity. Why the difference? We hypothesized that it may have to do with the environments the populations are adapted to- the splittail here used to live in environments of more stable and predictable salinity, until humans made things less predictable and often saltier. On the other hand, if something like the killifish evolved in wildly unstable environments, then maybe plasticity and selection happen in the same genes and genetic mechanisms.Who cares?

Who cares?

Anyone who is interested in using RNA sequencing in wild organisms might care. We showed that genetic surveys with RNA data do reflect general patterns seen with DNA, but to potentially lesser degrees. This could be helpful for ‘double dipping’ with data, so to speak, by getting one RNAseq data set that tells someone about both physiological and genetic differences among groups. Another group of people who may be interested are ones studying how evolution and phenotypic plasticity interact. Those are broad topics and this paper is a tiny contribution to that whole field, to be sure, but science is all about building up evidence.

If I were to do this study again, or had more time, I might apply something like iqtree to get a better idea of the evolution of genes in the RNA data. For instance, dN/dS might tell us about the ‘strength’ of selection in different genes and differentiate those that are mostly affected by neutral processes versus directional ones. Newer methods such as long-read RNA sequencing could make our inferences about splicing better than we could with this short-read RNA data. In any case, this paper was not earthshattering, but certainly advanced science in a few small ways and that’s a good thing.

Double Duty for RNA: Part 1

Genetics used to be studied by looking at an organism’s phenotype, such as how peas looked, mutant fruit flies, or guinea pig coat colors. Richard Lewontin and John Hubby came up with the idea of running proteins through a gel to infer genetic variation- electrophoresis. Now though, genetic variation is practically only studied by looking at DNA, rather than proteins or external characteristics. Which is fine and useful. DNA is where that variation is ultimately stored, after all.

From Wikipedia.

But there’s another piece in the DNA-to-phenotype pipeline I haven’t mentioned: RNA. It’s an intermediate, as DNA is transcribed into RNA, which is translated into a protein, in a process Francis Crick called the ‘central dogma‘. Strictly speaking, it’s wrong that information only flows in that direction, and RNA can do stuff too, so it’s not like proteins are the only endpoints of this process. I also tend to avoid thinking of concepts in terms of ‘dogmas‘ since science should be among the least dogmatic fields humans engage in. But broadly, for many genes, RNA has an important middle role between DNA and protein. What if we used it to study genetic variation?

This is a ridiculous idea, of course. There are advanced DNA sequencing methods that give up to 2.3 million base pair sequences in one go, or another sequencing method that yields hundreds of millions to billions of read copies from a single reaction lane. So it’s not like we’re limited by technology like Mendel, Morgan, and Wright were. But RNA sequencing is also possible and widely-used, to answer physiological questions such as what molecular mechanisms individuals used to respond to some stressor (shameless self-citation). Since RNA is transcribed from DNA, naturally the RNA will reflect the same sequence variation that DNA did. So in principle, RNA sequences tell us about genetic differences in similar ways to DNA sequence differences. And if someone was collecting RNA data anyway for a molecular physiology-based study, of course it could be used for genetics.

Our study

That’s our study. It’s on the walleye, a species consistently important for Canadian fisheries and called yellow pickerel in this table. Fish were caught from throughout Lake Winnipeg, and we non-lethally took gill samples in RNAlater for mRNA sequencing. The differential gene expression part of the study will be published soon, but I led the genetics side of the project.

Figure 1 from our paper, showing sampling sites in Lake Winnipeg.

The results are pretty straightforward, as far as genetics goes. Walleye are slightly different in a North-South gradient in the lake, which makes sense since the lake is kind of vertically laid out. Plus, the fish are known to move around a lot in other lakes and this one, so it’s not like fish from one part of Lake Winnipeg are isolated from another. We identified some differences across the lake nevertheless, and this is where RNA becomes pretty interesting- those differences could easily be tagged to particular genes. That’s because genetic differences in this case were measured with ‘single nucleotide polymorphisms’, or single base pair changes between individuals. These SNPs (pronounced ‘snips’) reside within the RNA transcripts we sequenced, and those transcripts can be linked (‘annotated’, in science-speak) to particular genes.

…Those genes let us look at what actual differences there might be between walleye of the north and south basins of Lake Winnipeg. For instance, people love their Manitoba greenbacks, walleye with a nice green colour that also tend to be nice and big. Perfect for fishing pictures. Those greenbacks haven’t been scientifically assessed, but they do seem to be from the southern part of the lake. And if there’s a genetic basis to their greenback-edness, then we might have caught the differences in those genes with RNA sequencing. More scientifically, the north and south parts of the lake are pretty different. The Red River in the south dumps a bunch of mud into the south basin, while the Dauphin River in the north takes relatively salty water from Lake Manitoba into the north basin. So if walleye hang out in one area versus the other more often, over time they might adapt to their environments to some extent. But again, the differences between fish in the two basins were small.

Interestingly, genes that seemed different between the two basins based on having multiple SNPs in their transcripts fell into a few categories. We expected signaling and expression regulation genes since regulation is one of the most regulated things by regulatory mechanisms in cells (regulators regulate regulators?). Cell membrane and cytoskeletal genes were certainly cool to see though, and potentially consistent with those environmental differences between basins in the lake. We spent some time writing about Claudin-10, for example, because mRNA abundance was associated with salinity in medaka. Could it be important in walleye? Maybe. But unfortunately, we did not have the resources to actually look at the protein made by the Claudin-10 or cell adhesion differences that might have been caused by that genetic variation.

Table 3 in the paper, showing genes with multiple outlier SNPs in them that might be important for subtle walleye differences in Lake Winnipeg.

The methods are extensive, but most of them are there to cover our genetic bases since we’re using unusual data. For instance, we used Colony to look for siblings in the data like in another paper I wrote, to address potential sibling structure in our samples. Luckily there were no siblings among our walleye. Another filter was for SNPs in Hardy Weinberg Equilibrium for the population structure-based analyses (not the signatures of selection in genes described above). If I did the paper again, the Hardy Weinberg filter might be the first thing I remove since SNPs out of that equilibrium aren’t inherently uninformative. In addition, if I had another go at the project I might apply something like the HDplot program to address potential paralogy, and think about some kind of downsampling or normalization approach to address ways that read depth across individuals and transcripts within individuals may bias SNP calling and results. The conclusions about subtle differences in walleye across the lake aren’t wrong, though, since a follow-up study we did with DNA and more samples confirmed the initial results.

Who cares?

Fisheries and Oceans Canada researchers care, for one. They funded the study, and prior to our transcriptomic work here, the only other genetic study on Lake Winnipeg walleye had used more limited microsatellites. Not that it was their fault, it’s just microsatellites were the technology available at the time. This was the first genomic survey of walleye in the lake, although coauthors and I did a DNA-based one with more individuals later in my PhD. By confirming that Lake Winnipeg walleye are mostly the same across the lake, but establishing subtle differences between basins, managers have more context in which to make decisions about the fishery.

Anyone who wants to double dip with their data might care, as well. I referred to RNAseq being useful for molecular physiology above, and that’s still true. So if someone wanted to study molecular physiology and genetics? Well, RNAseq could be useful. In fact, it’s practically screaming to give us integrative genetic+physiological results when samples are taken in an appropriate way, something I’ll cover in a future week.

Of course, RNAseq for a certain number of individuals is more expensive than DNA sequencing. How much more expensive depends on the number of samples and how many reads you need. Generally, higher depth (more sequencing reads, as I use the term) means that someone is more likely to identify rare RNA transcripts in a dataset, and have more robust differential gene expression results. However, population genetics requires much higher sample sizes than does RNA sequencing. So the molecular physiologist is incentivized to get fewer individuals and more data per individual (e.g., 6-10 individuals per group with 50 million+ reads each), while the geneticist is incentivized to get more individuals and does not need as much data to call SNPs (e.g., 20-30+ individuals per group, with many times fewer reads necessary per individual). For similar reasons, many RNAseq studies take their individuals from one population, which I loosely mean as a genetically distinguishable group of individuals. The scientific value of results from looking at the genetics of one population is more limited than otherwise, since many population genetic tests involve contrasting groups. Other RNAseq-based studies study captively bred individuals, whose parents were sampled from the wild. The data from the offspring of wild parents is filled with complex issues introduced by family structure, and there’d be all sorts of issues with trying to generalize those results to the wild population.

Why did our study work? Because randomly sampled wild large walleye from 3 sites in Lake Winnipeg, over two years, with 8 fish chosen for RNA sequencing per year per site. That’s 8 x 3 x 2 = 48 fish, which is not great but not terrible for genetics. From the one RNAseq dataset, we got to look at both how different the fish are in different parts of the lake (this study) and how they are responding to their environment (soon to be published!).

If a researcher is thinking about assessing the genetics of individuals across an environment, then it’s possible that using RNAseq to also get that physiological information is a good idea. Alternatively, someone could be considering a survey of the physiological responses of individuals across an environment. That second person would have the much cheaper, but limited to few genes qPCR to assess mRNA transcript abundance, or RNAseq. If they chose (and had the budget for) RNAseq, they could consider whether the sampling strategy works for genetics, as well. One thing unmentioned in this post are specifics of getting molecular physiology results from the data, and practical ways to combine the genetic and physiological results. That will have to be covered in part 2

Where for art thou, genetic variation?

If I could re-title any of the papers I’ve written so far, “To breed or not to breed? Maintaining genetic diversity in white sturgeon supplementation programs” would be the one. But it’s nevertheless a good paper, and has had a decent impact since publication. Unfortunately, the Shakespeare reference is clearly not an original thought.

Just 8.43 million people had the same idea as me.

It covers an important topic: when we have to supplement wild populations, how do we maximize genetic variation? The world is undergoing a sixth mass extinction, largely thanks to humans. It’s practical to directly help many species that need conservation attention, such as by taking them in to captivity to grow to a larger size or to breed, where their young can be released and survive in hopefully greater numbers than they would in the wild. That’s the supplementation bit- we sometimes supplement wild populations by nudging individuals along. Related practices are reintroduction programs, where species are put back into places where they used to live.

White sturgeon

White sturgeon certainly need the help. They’re remarkable fish, with Jurassic-looking scutes on their sides and they grow to enormous size. Scientists call sturgeons ‘living fossils’, partly because of how they look, and partly because they literally resemble their fossils from tens of millions of years ago. However, white sturgeon are listed as endangered under both Canada’s Species at Risk Act and the United States’ Endangered Species Act.

The Idaho Power Company is one of several groups that does conservation supplementation with the white sturgeon, and they funded this study. What they and other groups normally do is catch adult male and female white sturgeon before spawning season in the Spring, cross their eggs and milt, then release adults. The young are raised up, then released after some time. That’s a normal supplementation program. The Idaho Power Company’s program is in the Snake River of Idaho, which has some awesome waterfalls.

Our study

What we all wondered was: what’s going on with genetic variation when someone catches a few adults for supplementation? Again, white sturgeon are huge, so no one could keep too many for spawning. And if someone knew where they spawned naturally, could the eggs get sampled after they get spawned naturally and raised up? That way, the dangerous first year of life could be avoided by staying safe in a hatchery, while maybe more genetic variation would be maintained by having the offspring of more parents raised up. For brevity, we called this second way of doing things ‘repatriation’, since young are taken out of a river, raised up, and repatriated back into it. Our study compared those two methods: broodstock and repatriation versions of a supplementation program.

The folks at Idaho Power got us nice eggs or tail clips on which to do genetics, but sturgeon make things tricky for genetics in an unusual way: they are polyploid. That is, they have many (poly) copies of each chromosome (ploid). We humans have two each so we’re diploid, but white sturgeon are octoploid, with 8 copies of each. Ridiculously, they can sometimes get 12(!) copies of each chromosome which makes some of them dodecaploid, but we did not need to deal with the 12 copy thing here. Relevant for us doing genetics on these animals, we have to address how to measure genetic variation and other stuff with such weird ploidy issues.

This is figure 3 from Lebeda et al. 2020, and it shows Russian sturgeon chromosomes but they’re octoploid, too. Genetically speaking, this is nuts.

Most population genetic tests such as FST, or approaches for delineating groups such as STRUCTURE assume diploid data, since a huge number of the organisms scientists are interested in are diploid. Humans, fruit flies, and so on. Andrea Schreier, my supervisor at the time of doing this paper, spends a lot of time thinking about how to deal with these higher ploidy issues and genomics. One approach she uses, and that we used for this project, was to code each allele as a genetic marker. Normally, for diploids a genetic marker has some values to show different alleles in it- 0, 1, and 2 for homozygote reference allele, heterozygote, and homozygote alternate allele is one common format. Another common format is 11, 12, and 22, where the 1’s and 2’s literally refer to alleles (the 12 being a heterozygous genotype at a marker). Another is 0/0, 0/1, and 1/1, which is where the 0’s and 1’s instead refer to alleles. But with polyploids, the data can become a table of 0’s and 1’s, where a 0 means the allele is missing from an individual, and 1 means it’s there. Unfortunately, if an allele is present, we do not know how many copies of it is there- it could be anywhere from 1 to 8 copies with octoploid white sturgeon. In any case, the data format works, and are called ‘pseudodiploid-dominant genotypes’ when they’re in the format.

One place the data format is particularly suited is in pedigree reconstruction. That is, estimating the family relationships in a set of samples. For our purposes, this boils down to defining full siblings (brothers and sisters), half-siblings, or non-siblings since the samples we had were from particular years. This sibling information is useful for defining the number of parents represented in a group. One thing we want for the white sturgeon is to maximize the genetic variation we’re putting back in the river with these conservation programs. And one way to maximize genetic variation is to maximize the number of parents represented by a group of fish that we release. That idea is the core of the paper. Which method, broodstock or repatriation, helps us represent the greater number of parents for fish we raise up and release into the wild?

Repatriation. By far. No cliffhanger or plot twist here. In this case, it was by much better than catching adults to breed in a hatchery (broodstock sampling). Using the program COLONY with the special data format for polyploids, it identified the number of ‘spawners’ or parents present in each of several years of data for when the Idaho Power Company was trying repatriation. And the number of spawners present for the years they tried the broodstock sampling required no statistics or genetics or anything fancy at all; they just needed to count the number of adults used in each year, which was 3 males and 3 females. By contrast, the repatriation approach gave us a minimum of 24 spawners represented in each year, and up to 166 in one year (Table 2 in the paper).

Genetic variation was much higher for the repatriation groups, as well. We could not use more typical measures such as heterozygosity because of white sturgeon’s polyploidy (but it might be possible now?). However, we could use something analogous to allelic richness– the number of alleles, or literally counting up how many alleles were present among different groups. Here again, repatriation beats out broodstock sampling for maintaining genetic diversity in white sturgeon. The number of alleles captured in offspring with broodstock sampling was 77 and 82 in two years of sampling, while the three years of repatriation sampling we tested gave us 101, 105, and 107 alleles in each. That’s around a 31% increase in genetic variation represented in offspring for supplementation, using back-of-the-napkin math.

Table 2 from Thorstensen et al. 2020, where we’ve been looking at the NA and NS columns.

Another paper did criticize the way I calculated the intervals for estimates of the number of spawners using Colony because the program uses a maximum likelihood approach to give its point estimates of sibling relationships. Fair enough, I’ve learned more about statistics since working on this project. The biological point, however, is just as strong as before: repatriation is better than broodstock sampling for white sturgeon supplementation. Heck, the biological conclusion might actually be stronger if we took Colony’s point estimates for the number of spawners in a dataset, because a human tendency is to look at the lower bound of an interval as a minimum value, but the point estimates from Colony will naturally be higher than the lower bounds I identified.

Who cares?

The Idaho Power Company cared, for one. In the 2022 meeting of the North American Sturgeon and Paddlefish Society, I got to see a talk about what they’d gotten up to since I worked on white sturgeon genetics. They have built new facilities and come up with whole new ways of raising up sturgeon eggs based on this idea that repatriation is better for conservation than broodstock sampling. It’s hard, tricky work because eggs they get from the wild are covered in all sorts of gunk from the river, which messes with high waterflow systems that they need to keep the eggs alive. But they’re doing it.

Anyone who is thinking about running a supplementation program might care about this idea of repatriation, as well. Genetic variation matters for conservation, and an approach that increases the genetic variation being released into the wild from a supplementation program is worth considering. We wrote about caveats though, such as the fact that spawning/nesting/breeding sites need to be known about to capture young individuals for raising up. That’s not possible sometimes, and white sturgeon work for that criterion because a population will come back to similar areas to spawn each year. It’s probably most effective in species that have lots of offspring as well, since it might be impractical to raise the offspring of a less fecund species. Could you imagine capturing a baby elephant to raise up and release? Also, parental care. Since repatriation as we describe it involves capturing offspring to raise them up for release, then it wouldn’t work for any species that needs parental care.

As of writing this post, the paper has 23 other papers citing it. That’s no Lowry protein assay, but it’s no slouch either. To me, the references from other scientists speak to the broad interest in sturgeon conservation worldwide and the interest in different strategies for conservation supplementation. While it’s a global tragedy that such conservation action is necessary, I’m glad there are people who are doing what they can for the natural world.

If you’d like a copy of this paper, email me! matt.thorstensen[at]gmail.com